In an urbanized world where digital communication is king, cities continually seek to innovate to improve dialogue and service delivery with their citizens and visitors. Utilizing data to proactively address citizens' needs, identify emerging trends in service requirements, and facilitate seamless communication and intervention as necessary, becomes essential.
Bciti has been working since 2020 on a project to process and enhance civic and urban data, transforming the latter into valuable tools for managers and decision-makers in cities and municipalities.
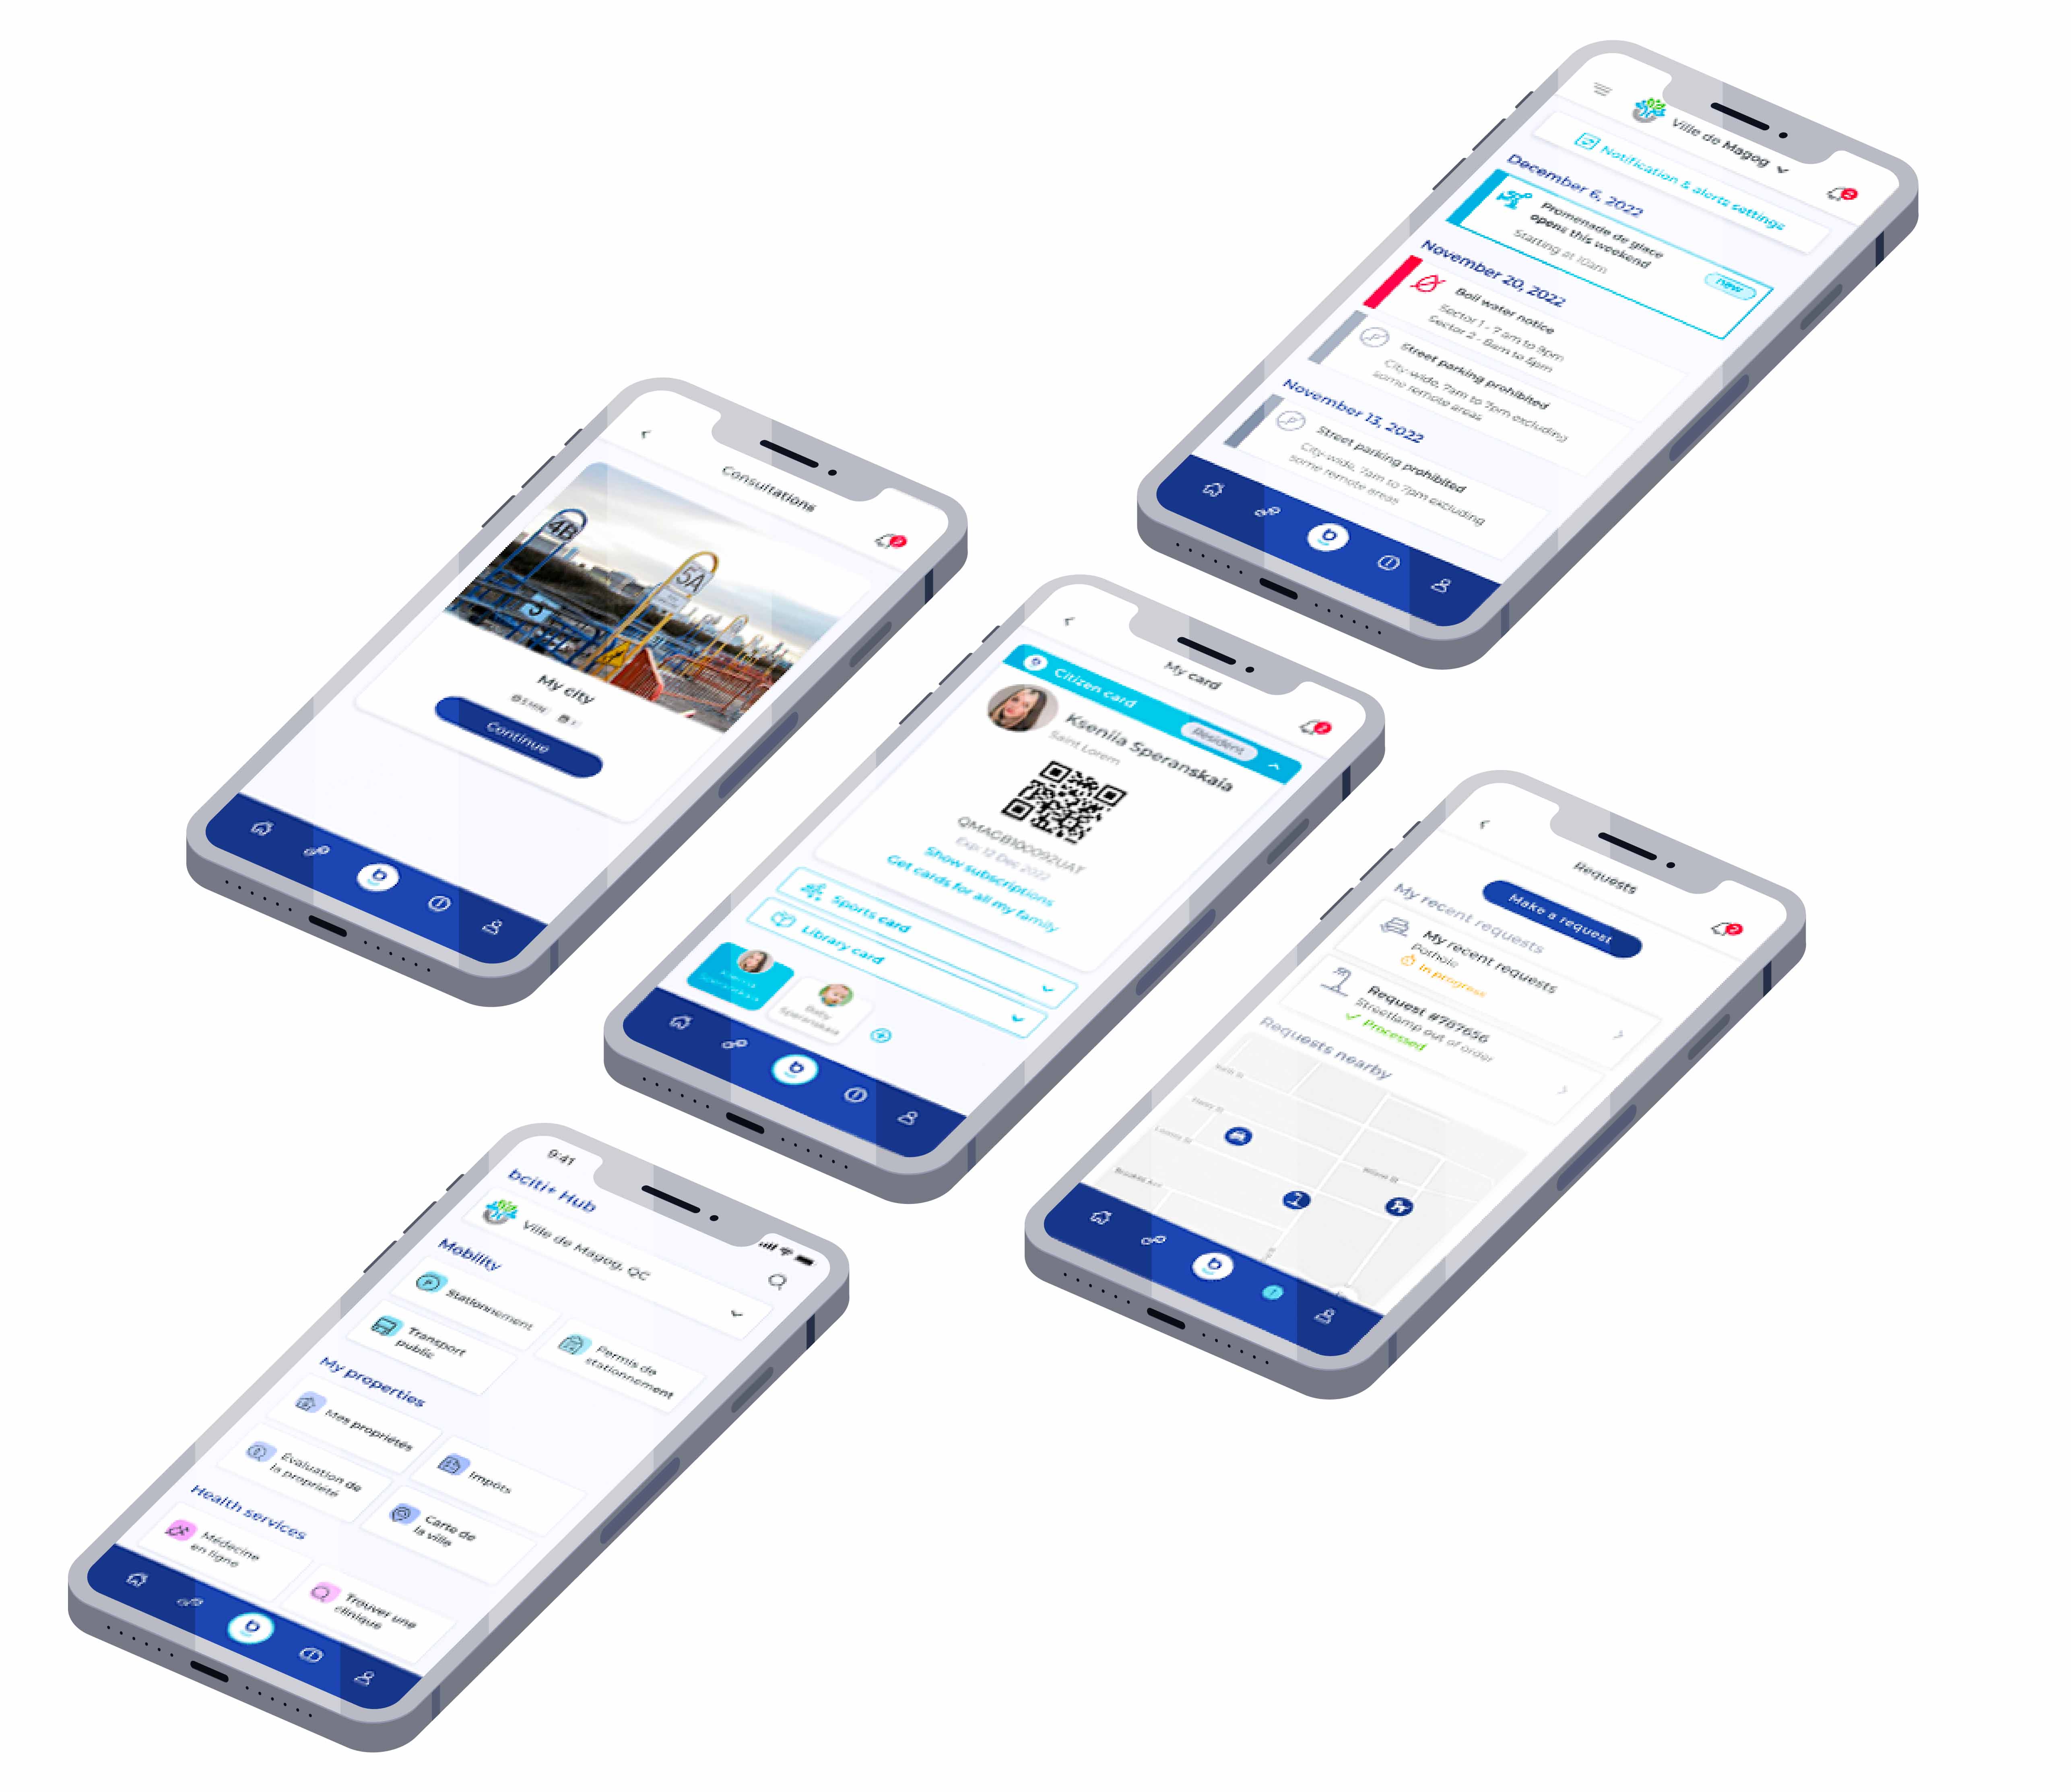
B-CITI Inc. (Bciti) introduces its latest advancement, the Intelligent Citizen Services dashboard, stemming from collaborative research conducted with IVADO and the University of Laval. Led by esteemed researchers François Bellavance, Ph.D., a professor at HEC, and statistician Saad-Ellah Berhili, this innovative project has successfully integrated enhanced functionalities into the bciti+ Intelligent Citizen Services Platform.
- An interactive dashboard to view and track historical municipal service data collected by bciti+
- The ability to integrate and visualize new data available online collected by bciti+ and to see which ones may be available soon
- The ability to Integrate a citizen component to raise awareness of actions to improve behaviors to create inclusive, safe, resilient and sustainable cities and communities.
Smart cities and masses of data
According to Wikipedia, a smart city uses Information and Communications Technologies (ICT) to improve urban services or reduce costs. These cities leverage the data collected to effectively manage resources.The utilization of data through unified interfaces empowers decision-making, enhances service delivery, and fosters transparency within the administration by providing citizens with access to shared indicators and statistics.
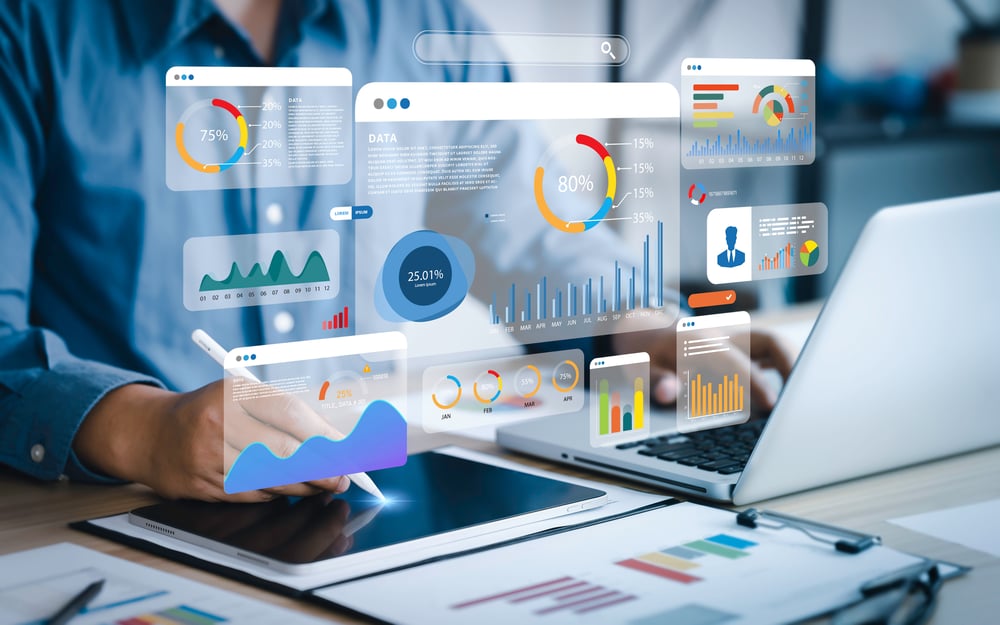
The Dashboard: A decision lever
Metropolitan cities around the world are deploying dashboards to share data with their citizens and visitors. A dashboard is an interactive platform that offers a dynamic and detailed vision of the city and allows budgetary efficiency to be analyzed. Dashboards serve as a barometer for urban performance and have become an essential tool for managers. By adding augmented analysis and new technologies such as machine learning, dashboards will be able to anticipate events and support proactive decision-making.
Benchmark of Dashboard used by cities in Canada
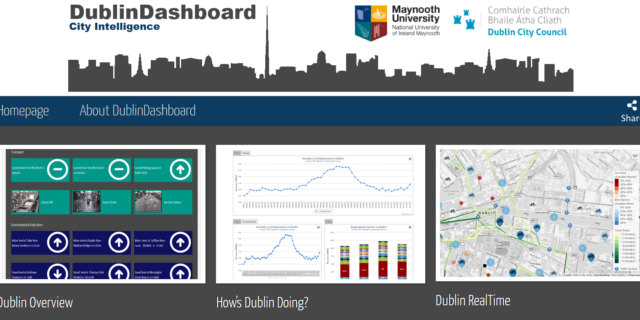
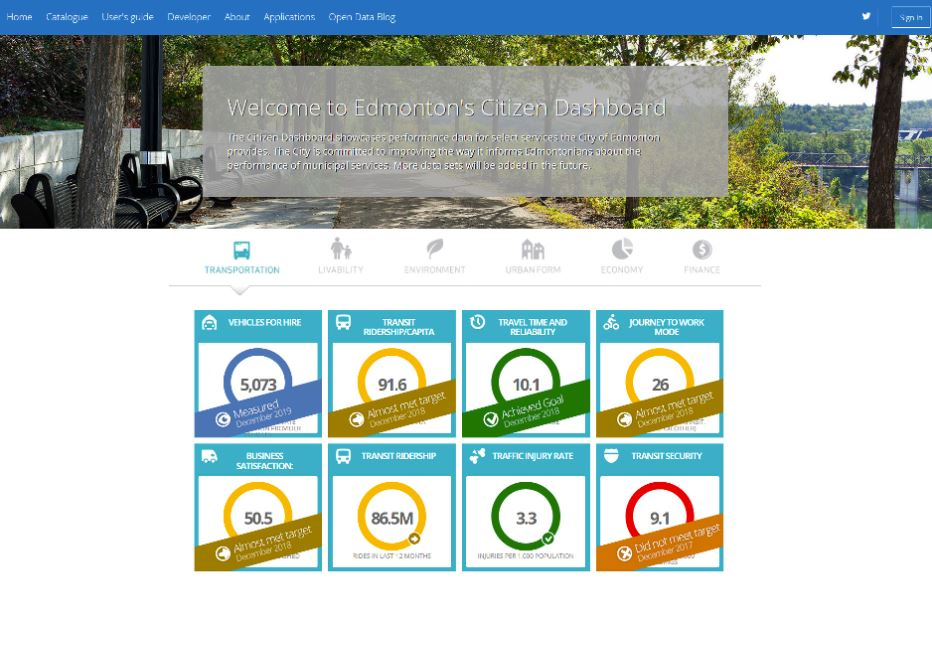
During a research project with IVADO, Professor François Bellavance and a PhD student in statistics, Saad-Ellah Berhili in 2020, observed best practices from the Dublin and Edmonton dashboards. The idea was to draw inspiration from these models to develop our own bciti+ dashboard focused on services to citizens, by presenting the stages of its design.
- Dublin, Ireland: A contextual dashboard providing real-time data, time series, and interactive maps
- Edmonton, Alberta: A strategic dashboard integrating data for decision-making, with various components such as transportation, quality of life and the environment.
The bciti+ Citizen Services Intelligent Dashboard Proposal
Inspired by the examples of Dublin and Edmonton and research results with Professors Francois Bellavance, Saad-Ellah Berhili and IVADO, the Bciti team developed a dashboard for active cities currently using bciti+ across Canada. This dashboard, first developed in experimental mode, has just been developed in its basic product version and will be deployed in all these cities immediately. Data from the bciti+ dashboard, coupled with external open data, will be translated into indicators and graphs to enlighten city decision-makers and inform citizens.
Data and Indicators
Since 2016, Bciti has been ethically collecting comprehensive data on citizens' service usage. This structured data, sourced from various modules, enables the creation of an initial streamlined Dashboard, centered around the needs and activities of cities currently integrated with its bciti+ platform.
The Intelligent Citizen Services Platform has enabled cities to achieve over $11 million in savings
Bciti's data collection revealed significant cost savings of over $11,000,000 for cities in Quebec, attributed to a select range of citizen services. This calculation stems from a return on investment study conducted by MBA students, validated by analysts at the renowned organization, Gartner. Notably, the calculation accounts for tangible reductions, such as the decreased use of paper, plastic, and printers resulting from initiatives like the digital citizen card. It excludes the saved time of city administrators previously allocated to in-person citizen card issuance. The fundamental bciti+ Smart Dashboard provides the following data:
Indicators |
| 1- Number of citizens registered on the platform |
| 2- Economy for the city |
| 3- Use by genre |
| 4- Use by age group |
| 5- User data on the digital card and services used |
| 6- Information on the characteristics of the vehicles used (e.g.: electric, etc.) |
| 7- Use of subscriptions and type of subscription |
| 8- Use of the notifications and notices service according to categories and media used |
| 9- Use of the request service (311) according to reporting categories |
| 10-Number and income linked to transactions (parking payment, etc.) |
In 2020, we also collected air quality data from IoT sensors and analyzed fine particles. The results help raise citizens’ awareness of their direct impact on reducing air pollution. For example, we have noted a significant increase in air pollution in winter, particularly linked to the fact that citizens start their cars to warm them up and congestion during rush hours. As our project was underway at the time of the arrival of Covid, we were also able to see a drastic reduction in air pollution linked to confinement.
bciti+ Intelligent Dashboard for smart cities: result of the research project with IVADO
Access to the Smart Dashboard provides an overview of citizen service data. This has several significant advantages for city administrators:
- Data-Driven Decision Making: Evidence-based data allows administrators to make informed decisions. The dashboard compiles complex information into a simplified visualization, making it easier to understand trends and issues, and helps guide service planning and public policy improvement.
- Effective resource allocation: By identifying areas requiring the most attention, administrators can allocate resources strategically, ensuring more effective budget and investment management.
- Continuous service improvement: Dashboards allow you to track service performance over time. This helps administrators identify areas for improvement and implement changes that improve service delivery.
- Rapid response to problems: With real-time or regularly updated data, administrators can respond quickly to emergencies or sudden changes in service requests or external elements of the City, including temperature.
- Citizen engagement: A publicly accessible dashboard increases transparency and can encourage citizen engagement. This can allow them to better understand how their cities work and participate more actively in municipal initiatives.
- Tracking progress toward goals: Dashboards can be used to define and track progress on long-term goals, such as sustainability goals or city strategic plans.
- Trend detection and forecasting: By analyzing historical data, administrators can detect trends and make predictions that will help them plan for the future.
- Coordination between departments: A centralized dashboard can improve coordination between different municipal departments, providing an overview of activities and facilitating communication.
- Public Policy Evaluation: Data collected and presented in the dashboard can be used to evaluate the effectiveness of existing policies and programs and guide changes or new initiatives.
- Optimization of municipal operations: Analysis from the dashboard can lead to the optimization of processes and better quality of municipal services, which can increase citizen satisfaction.
Another advantage of the bciti+ Intelligent Citizen Services Platform is its ability to ethically manage data. This is exemplified through its provision of secure and ethical data automation services, complemented by its patented technology ensuring data traceability."
The dashboard is designed to ingest, present and analyze data from the City's business systems, open data and Internet of Things data.
In short, an intelligent dashboard transforms raw data into “actionable insights”, thus facilitating urban governance, making it more proactive, responsive and responsible.